Understanding Inequality: Can Gini Coefficients Be Fruitfully Demystified? (Revised and Expanded)
TIER 4 Sun, 1 Jun 2025 13:35:41 +0000
Understanding Gini Coefficients (Revised and Expanded)
I am not sure that this is worth publishing—especially because my advice to others who ask me “how should I explain Gini Coefficients when I use them as inequality measures” is this: don’t use Gini Coefficients as inequality measures. The explanation distracts, and at the end whatever knowledge you have conveyed is evanescent and dies away, because people simply do not run into and use Gini Coefficients in their thinking for it to stick. By contrast, percentile-based measures of inequality are ones that people do run into much more often, and do tend to stick.
Nevertheless…
Provoked by Paul Krugman writing:
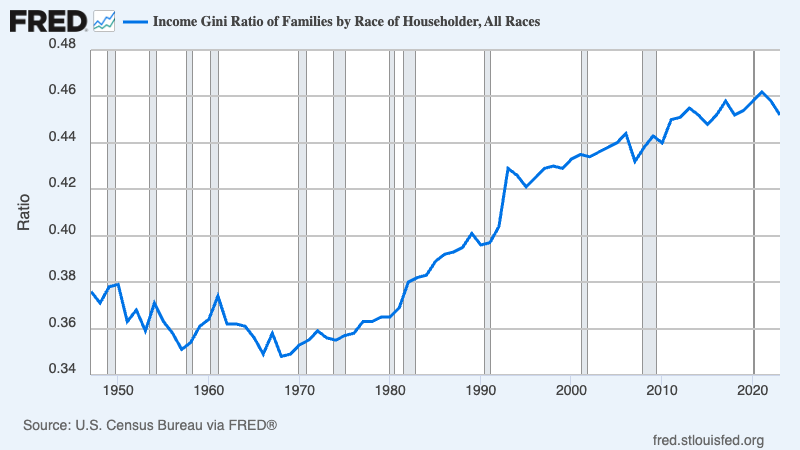
Paul Krugman: Understanding Inequality, Part I <https://paulkrugman.substack.com/p/understanding-inequality-part-i>: ‘Families at the 95th percentile… in 1950 they earned 2.43 times as much as the median family…. By 2023 families at the 95th percentile were earning 3.54 times as much…. To measure inequality I… prefer simple ratios like the ones above, but other economists prefer more complex measures like the “Gini coefficient.” I won’t try to explain how that coefficient works, but here’s what it looks like…
It is more-or-less standard for an economist to write “I won’t try to explain” whenever they are trying to communicate something about inequality, and finds themself confronted with data that comes in the form of the Gini Coefficient.
Now that is just weird: a measure—a number—but when trying to ground that number in anything, we quail and flee, on the grounds that it will be difficult to ground it, and pull us away from what we want to be the thrust of the argument.
So let me beg everyone: Please stop using the Gini Coefficient! Please use the 90th-median (2.90), or 95th (3.54), or 99th (10.2), or 99.9th (38.8), or the 99.99th (577).
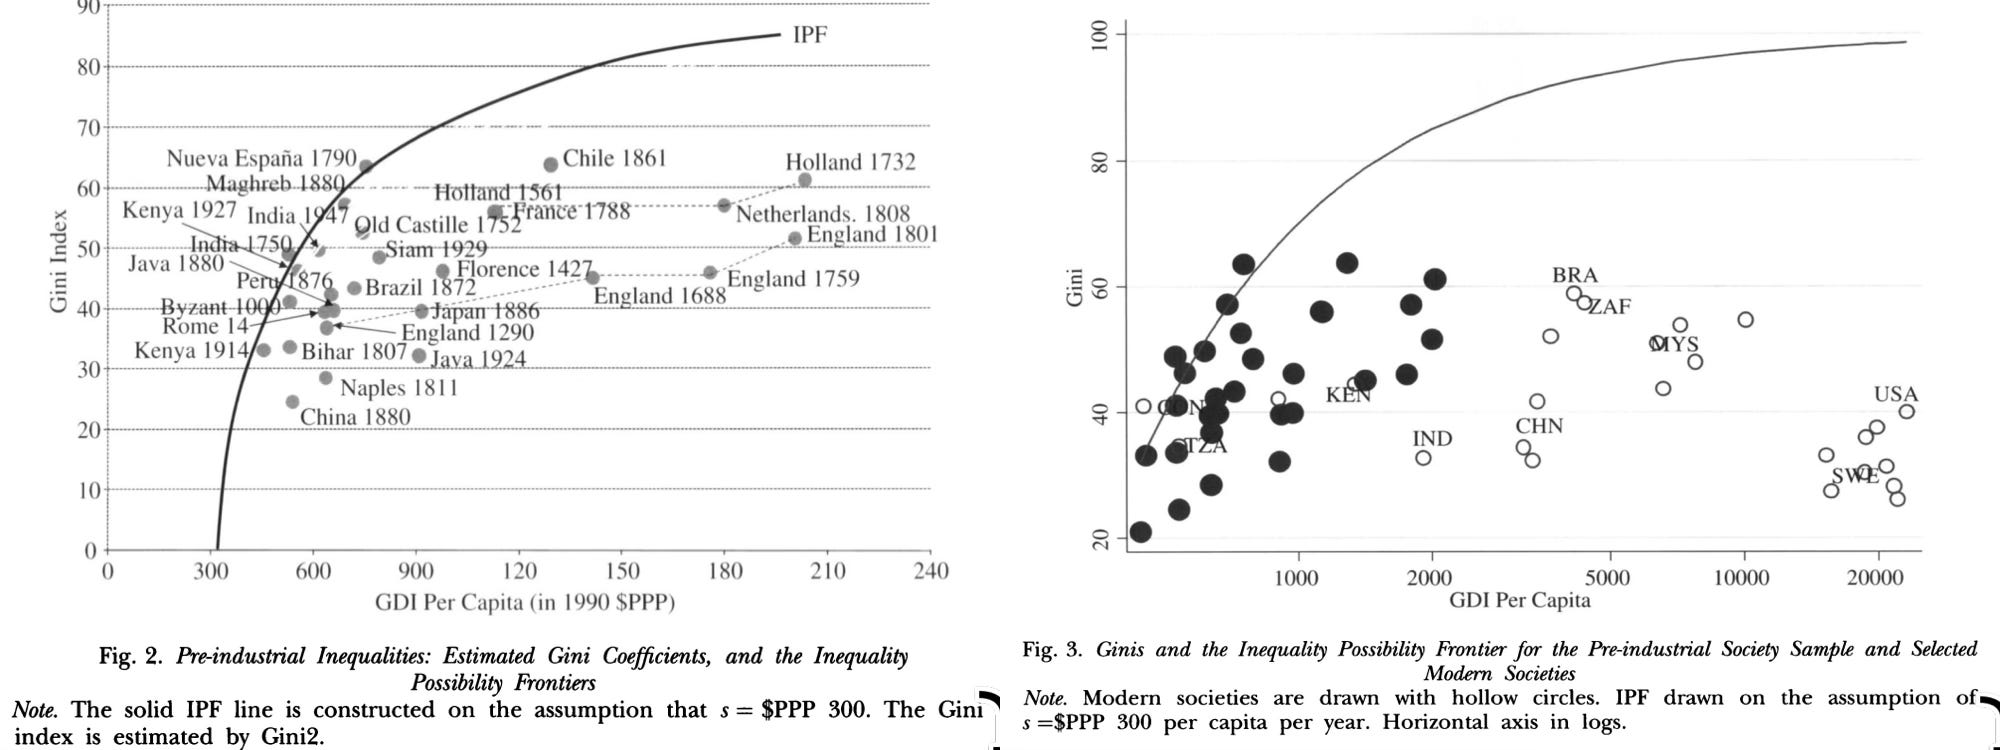
But suppose your data comes in Gini Coefficients, as in the excellent Milanovic, Lindert, and Williamson (2011):
Then what should you do?
Well, unless you want to rework the data intensively, you do not have much choice than to just bull ahead.
So you should then say: This is what the Gini means:
Take two members of the society at random, and subtract the income of the lower from the income of the higher.
Divide that by the society’s average income.
Multiply the result by 2 (or 200), so that complete inequality will get you a Gini Coefficient of 1 (or 100).
The expected value of that calculation is the Gini Coefficient.
It is a measure of how were two people to interact at random how large and salient, relative to the society’s average level, the difference in their incomes is likely to be.
And here is a finger exercise that might get some intuition for you as to what the Gini Coefficient means:
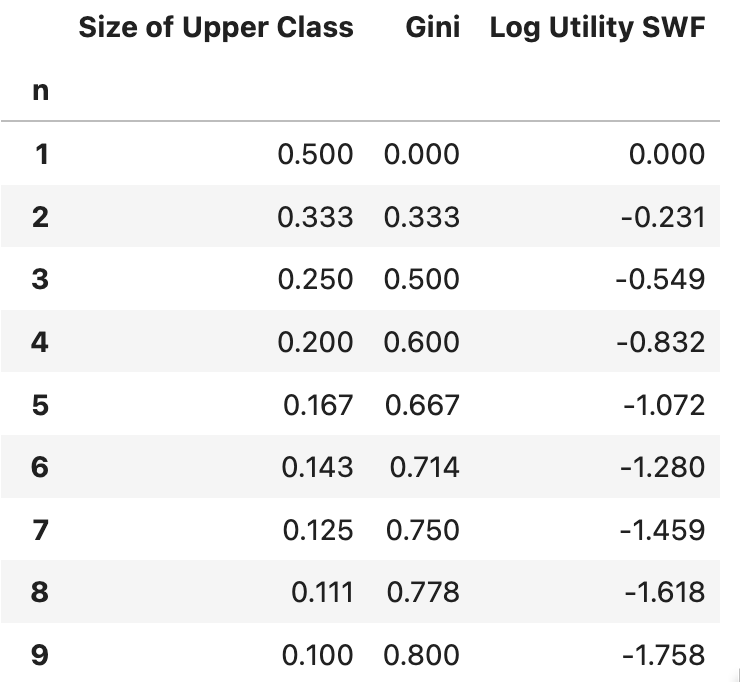
Suppose that a share 1/(n+1) of the members of the society are in the upper class and that each of them receives n times the average income.
Suppose further that the remaining n/(n+1) share members of the society each receive 1/n of the average income.
Then the Gini Coefficients and the utilitarian log-utility welfare measures for the society are:
For example, for n = 3:
The upper class is a quarter of society, and each member has three times the average income
The lower class is three-quarters of society with each member having one-third of the average income.
And, for n = 3, the Gini Coefficient is 0.5.
For this society, moving down to a Gini of 0.5 from a Gini of 0.6 is the equivalent of raising expected log income by 0.283—what would be given by a 33% increase in the geometric mean of income.
Now comes the extremely sharp Wendy Carlin to email me her: “Inequality as experienced difference: A reformulation of the Gini coefficient”. It contains smart things:
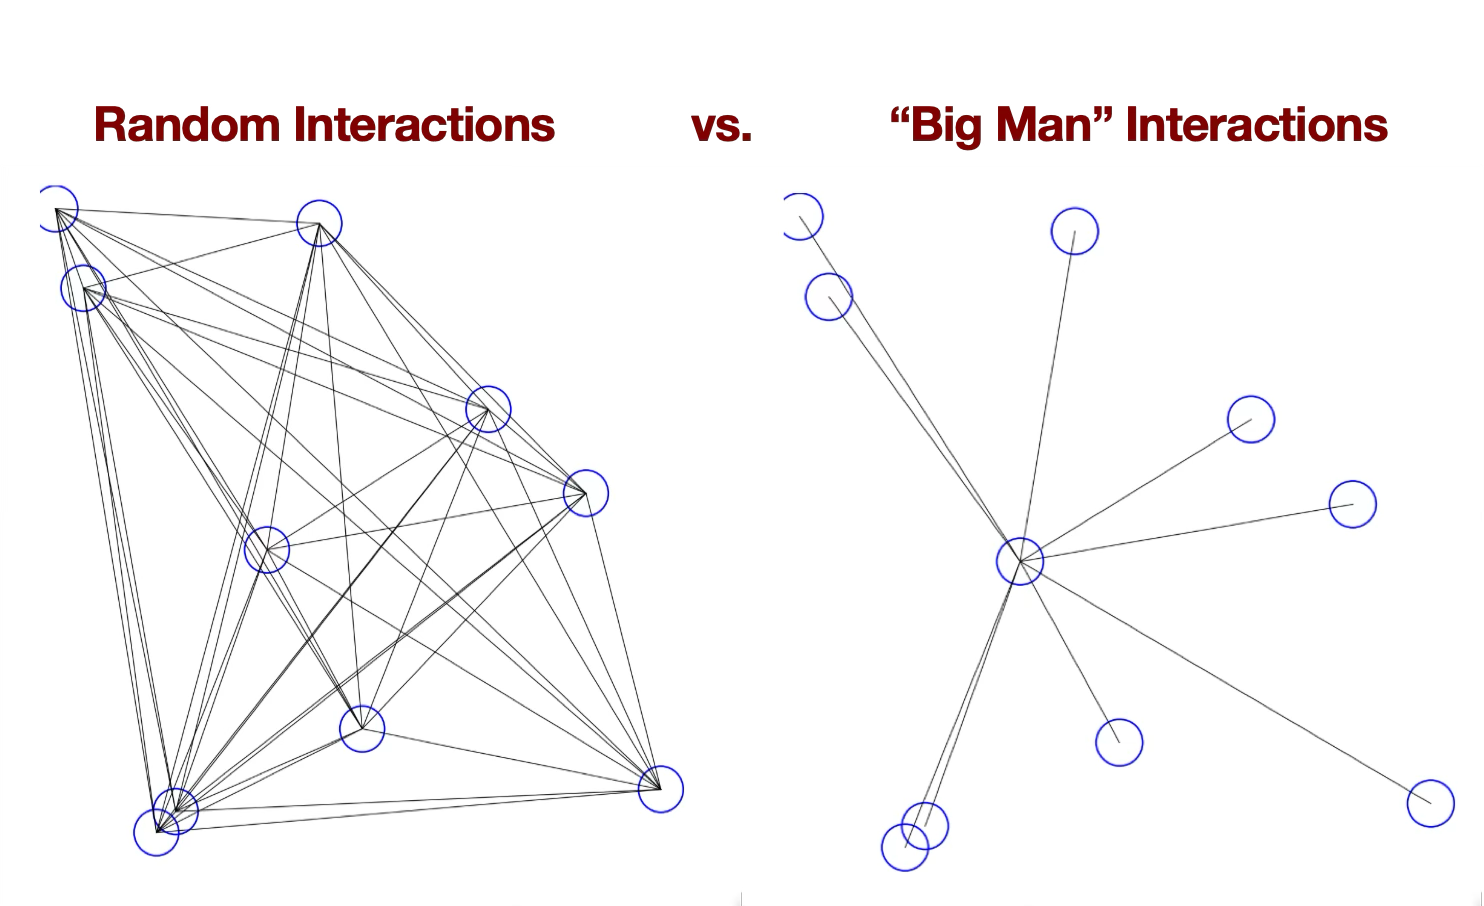
Samuel Bowles & Wendy Carlin: Inequality as experienced difference: A reformulation of the Gini coefficient: ‘The appeal of the Gini coefficient is that it is as Sen writes ‘‘a very direct measure of income differences, taking note of differences between every pair of incomes’’ (Sen, 1997)…. The difference-based measure can readily be extended to better capture the sociological and psychological dimensions of inequality that arise from the comparisons people make with others whom they routinely encounter…. Consider, for example, the effect of a change in the relevant social relationships from a complete network… to a star with the wealthiest person at the center as in… a ‘‘big man’’ system…. Experienced inequality would have increased… because households tend to interact more with other households of differing wealth than would occur by chance… <https://www.sciencedirect.com/science/article/pii/S0165176519303969?via%3Dihub>
As in:
Thus the question becomes: Is it more relevant to inequality as experienced that people tend to socialize with those of approximately their own status, but because of the division of labor interact in worklife with those of different status?
Or are these two distractions, and is inequality just what it is?
And what does “interact” mean, exactly?
I do have a sense that the second—in which the bulk of your important economic interactions are with somebody who has a very different amount of societal economic power than you do—is, in the relevant sense, more unequal, and will generate a lot more spite and envy. But is that sense correct?
References:
Alesina, Alberto; Paola Giuliano, & Nathan Nunn. 2013. “On the Origins of Gender Roles: Women and the Plough”. Quarterly Journal of Economics 128 (2): 469-530. <https://doi.org/10.1093/qje/qjt005>.
Jackson, Matthew, Rogers Bryan, & Yves Zenou. 2017. “The economic consequences of social network structure”. J. Econ. Lit. 55 (1), 49–95
Flannery, Kent, & Joyce Marcus. 2012. The creation of inequality: How our prehistoric ancestors set the stage for monarchy, slavery, and empire. Cambridge: Harvard University Press.