Lenny's Newsletter · Product & Work
TIER 5 2023-07-18
You won’t succeed at growth long-term without deeply understanding and operationalizing attribution and incrementality. You risk endlessly spending money on seemingly good ideas that have exactly zero impact. [Michael Kaminsky](https://www.linkedin.com/in/michael-the-data-guy-kaminsky/) and [Mike Taylor](https://www.linkedin.com/in/mjt145/) are two of the most experienced people I’ve met on the dark arts of attribution and incrementality, and in today’s special guest post, they share the most in-depth and practical explanation I’ve ever seen on the topic. It’s based on primary research into how 40+ top brands measure their marketing efforts, and I’m very excited to share it with you. *[Michael Kaminsky](https://www.linkedin.com/in/michael-the-data-guy-kaminsky/) previously built the data team at the men’s shaving brand [Harry’s](https://www.harrys.com/en/us) and is the co-founder of marketing analytics firm [Recast](https://getrecast.com/). [Mike Taylor](https://www.linkedin.com/in/mjt145/) is the founder of the training platform [Vexpower](https://www.vexpower.com/) and previously built a 50-person growth marketing agency called Ladder.*  Many people encountering marketing measurement for the first time are surprised that it isn’t a solved problem. “I spend thousands of dollars on ads every day. I should be able to just pull a report to see what I got for it,” they might think. Unfortunately, even brands spending millions of dollars on advertising per month still struggle with measuring the impact of those dollars. The most important problem in marketing is this: If we spend an additional $1,000 on some marketing activity, how many additional sales would we drive? Marketers sometimes refer to this concept as “incrementality.” Incrementality is difficult to measure because we don’t get to observe the world where there’s no marketing activity, what a statistician might call the “counterfactual.” So even if we record some person clicking on an online advertisement and then making a purchase, we don’t know if this is correlation or causation: they might have made a purchase anyway, even without seeing the ad, because their friend told them about it, maybe, or because they already knew the brand. Navigating the labyrinth of marketing measurement is daunting at first glance, given the sheer variety of strategies available and the inherent complexity of the field. Although it’s true you can never achieve 100% clarity in marketing measurement, you’d be surprised at how close you can get by combining the right techniques. We’ve built a database of 42 top consumer brands, such as Uber, Amazon, and Airbnb, providing unique insights into their measurement methods. These case studies present inventive and thoughtful approaches to marketing measurement and will help you shortcut your way to measurement success. [Check it out here](https://airtable.com/shrzPkZvLTZtcsnbI). Building on this research, below, we demystify the complexity of each measurement technique and provide a guide on how they operate and, most importantly, how you can implement each of these methods yourself. We’ll show you exactly what the biggest consumer brands are using and what’s interesting about the way they’re using them. 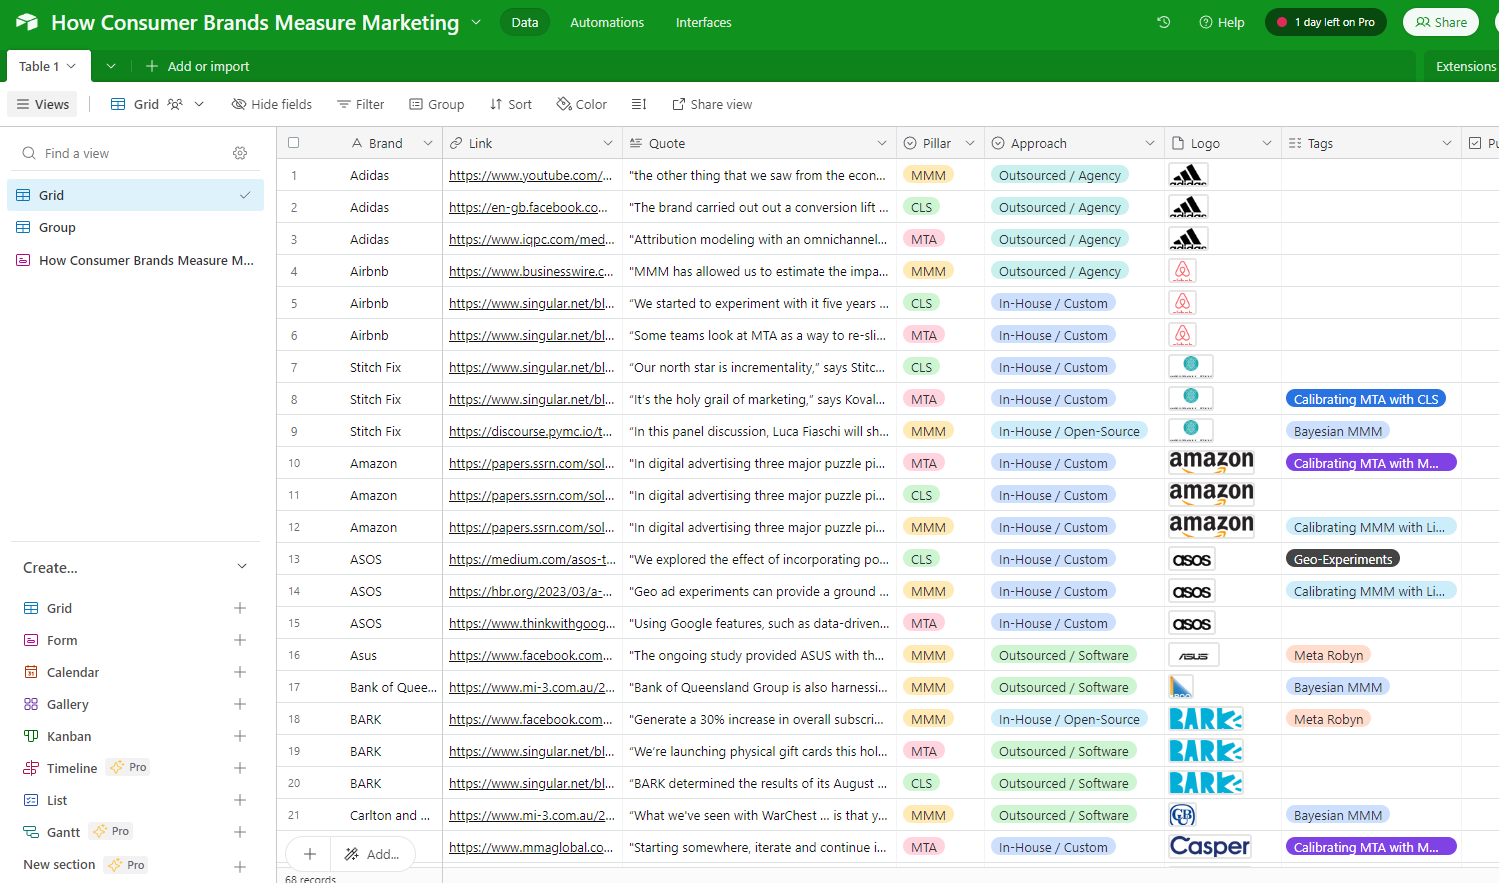 ## How do top consumer brands measure marketing? There are three main ways that brands measure marketing effectiveness: 1. **Digital tracking/multi-touch attribution (MTA):** the default for online marketing, where browser cookies (or similar identifiers) allow advertisers to track the marketing source of their customers 2. **Marketing mix modeling (MMM):** a statistical modeling technique that marketers use to determine which channels in their marketing mix deserve credit for sales, in order to reallocate budget to the highest-performing areas 3. **Testing/conversion lift studies (CLS):** regularly run by marketers to validate what performance would look like if you switched a channel off, or scaled spend up or down One growing trend we’ve seen in the database we created was the theme of “triangulation,” or using all three methods in conjunction with each other, to zero in on the truth of what’s working in marketing. Over 40% of the brands in the database are using at least two methods together, and around 20% use all three. Each of these methods has strengths and weaknesses, but by triangulating the truth through combining multiple methods, you can get a more accurate measurement. The goal of triangulation is to determine how many of your sales are “incremental,” meaning they wouldn’t have happened had you not invested in marketing. Using multiple measurement methods is like getting a second opinion after visiting the doctor: it can help you make better decisions. 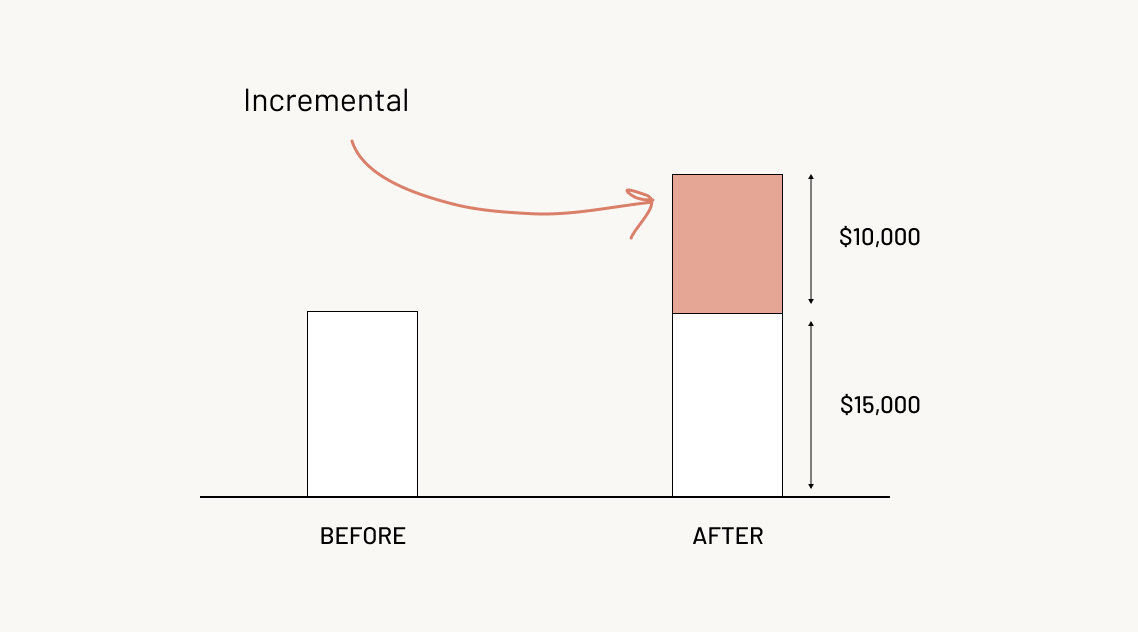 We’ll run through each of the methods, highlight how consumer brands are using them, and then walk you through how to implement them in your own business. Then we’ll cover how to combine them together through triangulation, so you can see how it works in practice for today’s top consumer brands. ### 1. MTA: Multi-touch attribution/digital tracking Digital tracking is measuring marketing performance through UTM codes or tracking pixels. When tracking is discussed, “last touch” or “last click” attribution is always mentioned as the default form of measurement on the internet. Last touch is easy to implement and understand, but it’s flawed because it gives zero credit to “touches” from other channels. Multi-touch attribution is a step more advanced, where you assign credit to different channels that a user interacted with (touched), based on predefined rules or a statistical model. The most consequential player in this space is Google and their measurement platform [Google Analytics](https://analytics.google.com/analytics/web/), which is installed on [60% of the top 100,000 websites](https://trends.builtwith.com/analytics/Google-Analytics). In addition to providing product analytics, GA is also used to measure the impact of marketing campaigns, which you can see in the source/medium report. We’ll talk through the basics of setting up analytics below, but there are thousands of high-quality walkthroughs on using [GA for attribution](https://support.google.com/analytics/answer/9397590?hl=en#zippy=%2Cin-this-article) across the internet and YouTube. 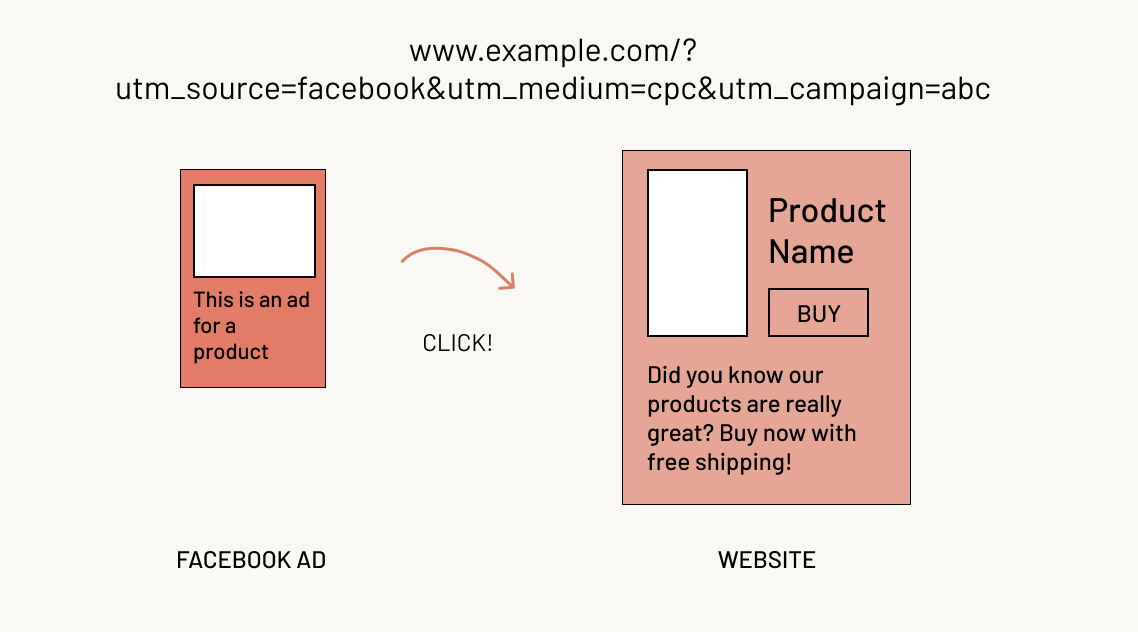 How this works technically is that the analytics tool or advertising platform drops a cookie (a unique identifier) in your browser so it can track your behavior across the website, and even across multiple websites or devices. Marketers add [UTM codes](https://app.vexpower.com/sim/lets-keep-our-utm-tracking-consistent/) to the end of the URLs (?utm\_source=facebook&utm\_medium=cpc&utm\_campaign=abc) that they use in their campaigns, which record where users came from, and an “event” is logged whenever they do something valuable, like buy the product or sign up as a user. The major distinction within this space is how you assign credit across channels. Users tend to not come from just one source—they may come back to the website multiple times via different channels before making a purchase or signing up. If you use the Google Analytics default “last touch” (assigning 100% of the credit to the last channel), you’ll favor lower-funnel channels like (surprise, surprise) Google Ads, as opposed to upper-funnel channels like TikTok or Instagram. Outside of Google Analytics, there are a variety of vendors in this space, including [Rockerbox](https://www.rockerbox.com/), [Northbeam](https://www.northbeam.io/), and [Triple Whale](https://www.triplewhale.com/), and many companies have implemented variations of this technology internally (my team helped build our internal version of this when I was at Harry’s). #### How consumer brands use multi-touch attribution This is by far the most ubiquitous method, and because most new startups are online, it’s usually the predominant method they use to measure marketing in the early growth stages. Paradoxically, because it’s so common, there are comparatively fewer case studies available compared with the other methods. You can safely assume that everyone that sells products online is using this method in some form, because everyone has Google Analytics installed. The cases we’ve included in the [database](https://airtable.com/shrzPkZvLTZtcsnbI) are where they’re doing something interesting over and above the standard implementation of Google Analytics, like a custom model or unique approach. 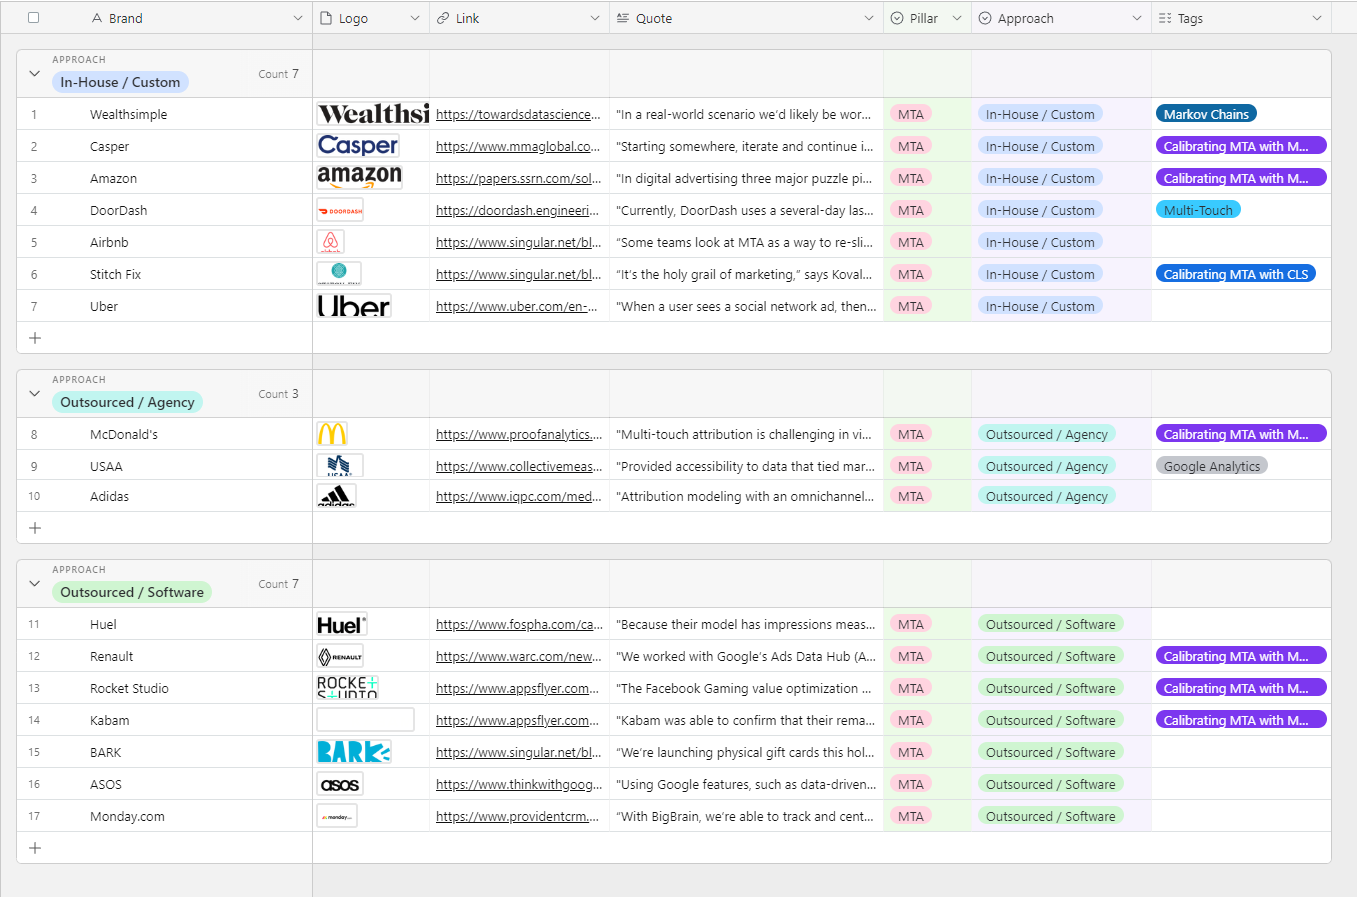 We found 17 instances of top brands talking about MTA in case studies, which is 40% of the brands featured, although it can be assumed that 100% of the brands use analytics and tracking pixels. Here are a few select quotes we found interesting, to highlight how top consumer brands are thinking about digital tracking/MTA: > **[DoorDash](https://doordash.engineering/2021/08/10/predicting-marketing-performance-from-early-attribution-indicators/): “Currently, DoorDash uses a several-day last-touch attribution system for all digital marketing channels, which provides a good balance between a holistic view of conversions for most ads, and reasonable wait time for fully refreshed attribution performance.”** It was surprising to me that a company as sophisticated as DoorDash would be using last-touch attribution, as detailed by Zhe Mai on their data science team. When I started in marketing over a decade ago, everyone was moving away from last-click, because it was universally agreed that it had obvious issues in biasing toward “lower funnel” channels like Google Ads. Lower-funnel channels are more likely to be the last channel that a user interacts with before purchasing, but they shouldn’t get 100% of the credit! However, I think the fact that DoorDash is still using it highlights the pervasive nature of the last-click model: it’s simple and easy to interpret, as well as being the easiest to measure, so it’s still very commonly used across the industry, including at very sophisticated companies. > **[Airbnb](https://www.singular.net/blog/experts-from-airbnb-stitch-fix-and-bark-box-on-multi-touch-attribution-incrementality/): “‘Some teams look at MTA as a way to re-slice the pie,’ he said. ‘It kind of makes one channel look better, or one team look better . . . but the pie doesn’t get bigger. The key is to use multi-touch attribution to make the pie bigger.’”** This quote from Airbnb’s then–growth marketing lead Dmitry Stavitsky reminds us to not get sucked into the battle for budgets that attribution often comes down to. Different attribution models will make one channel look better than another, which can cause political infighting in siloed organizations. The goal should be to make marketing perform better, which ultimately leads to more success and financial reward for everyone working at the company. > **[Uber](https://www.uber.com/en-GB/blog/euclid-marketing-engineering/): “When a user sees a social network ad, then searches ‘Uber’ on the web, clicks a search ad, and later signs up with Uber, it’s not fair to give all the credit to the search ad. Multi-touch attribution, another challenge Euclid tackles, involves looking at the impression level data, analyzing the complete user conversion journey, and then attributing the right weight of credit for each conversion to multiple channels.”** As you might expect, there were several cases where fast-growing startups and larger enterprises saw fit to build a custom system, like the one Uber describes above. Companies like Uber pride themselves on their engineering and statistical talent and have the capability to manage such software in-house, adapted to their specific needs. One thing that was surprising was how we couldn’t find any examples of open source software, even among companies that have open-sourced their software for other methods like marketing mix modeling, like Uber has with their “Orbit” model. Perhaps MTA software isn’t as generalizable, or it could be that it’s seen as a “secret sauce” internally. #### How to set up tracking and analytics Digital tracking, despite its issues, is a good starting point for brands that are primarily online. Start with a [tracking plan](https://www.reforge.com/blog/why-most-analytics-efforts-fail), which details what you want to track and when that occurs. This can take the form of an Excel spreadsheet on up to a dynamically updated [event tracking system](https://www.avo.app/) that’s integrated with your software deployment process or [tag manager](https://segment.com/docs/protocols/tracking-plan/create/), depending on your required level of sophistication. Once you’ve agreed on your tracking plan, you should implement a tag manager, which lets you record data once and then push it to where you need it. Google provides a free product called [Google Tag Manager](https://tagmanager.google.com/#/home), but there are also more sophisticated options like [Segment](https://segment.com/) that have a cost associated. The benefit of using a paid product is typically better collaboration and monitoring functionality, as well as ease of implementation. Now set up tracking pixels for each ad platform, and choose your analytics software. Google Analytics 4 is a good default for the web, although not everyone finds the interface to their liking. Mobile tracking is more complicated, because the Apple App Store is a barrier past which tracking parameters don’t cross. You have to use a link attribution service like [AppsFlyer](https://www.appsflyer.com/) or [Branch](https://www.branch.io/), which work with various methods to re-associate each install to the campaign they came from. Whatever stack you use, you’ll find more advanced use cases necessitate setting up a data warehouse that pulls in all your analytics data, as well as your advertising spend data via a provider like [Supermetrics](https://supermetrics.com/) or [Funnel.io](https://funnel.io/). Once everything is in one place you can build your own MTA models, with your own rules, as well as analyze the data in various reports through a data visualization tool like [Looker](https://www.looker.com/) or [Tableau](https://www.tableau.com/). ### 2. MMM: Marketing mix modeling Before we had the internet, how did marketers measure ads? You can’t click on a TV ad or tap on a newspaper to get to a website. [In the 1960s](https://getrecast.com/econometrics-history/) a technique called marketing mix modeling (MMM), a subset of econometrics, was developed to measure the contribution of each channel to sales. More recently this technique has grown in popularity because it only needs aggregate data and therefore doesn’t have any privacy concerns. Meta’s open source [Robyn](https://facebookexperimental.github.io/Robyn/) library has made MMM more accessible, and a number of vendors (including [Recast](https://getrecast.com/)) have worked toward modernizing the technique.  The method involves building an advanced statistical model, which correlates spikes and dips in sales with events and actions in marketing. So for example, if every time you increase paid advertising your organic sales rise, MMM can pick that up. This works independently of what your platform or analytics tool is telling you, so it’s used to fill the gaps in tracking and get a truer sense of what channels are really contributing to the bottom line. However, it can struggle with granularity at the campaign or [creative level](https://marketingmemetics.com/essays/message-mix-modeling). Additionally, the results are very sensitive to the sophistication of the model, and it’s easy to get incorrect results if the model isn’t set up correctly. The big divide in methods is whether you use a traditional vendor like [Nielsen](https://www.nielsen.com/solutions/marketing-optimization/marketing-mix-modeling/) or one of the more modern techniques. This is an important departure, because traditionally MMM is slow and expensive, meaning it’s usually run just once or twice a year, even by big brands. With more modern approaches, the models are more automated, and you can set up a data pipeline to update the model and optimize your marketing budget more regularly, like two to four times a month. #### How consumer brands use marketing mix modeling We have the most case studies on this method because we built the [database](https://airtable.com/shrzPkZvLTZtcsnbI) for a blog post on [who’s talking about MMM](https://getrecast.com/mmm-examples/) in case studies. If we tried to collect case studies even five years ago, we would have been left with boring corporate drivel, but what’s normally a dry space has exploded since the advent of iOS 14, when Apple introduced the ability for users to say no to tracking. There has been a lot of innovation in the space, and, refreshingly, people seem eager to share what they’re doing, which has helped progress happen faster than it otherwise would.  We found 35 instances of top brands talking about MMM in case studies, which is 82% of the brands featured. Here are a few select quotes we found interesting, to highlight how top consumer brands are thinking about MMM: > **[Uber](https://arxiv.org/pdf/2106.03322.pdf): “Recent consumer privacy initiatives (e.g., Apple’s announcement of no-IDFA 1 in iOS 14) further underscores the strategic importance of future-proofing any marketing measurement game plan with MMM.”** Uber pins down precisely the reason for all of the recent momentum in this space. With a big gap in MTA tracking, marketers can no longer rely entirely on that method and have been branching out to techniques like MMM. Uber has been a large proponent of this in releasing their open source library Orbit, which is technically sophisticated but isn’t a full out-of-the-box MMM solution. Uber was just one of the companies in the database using multiple methods: 40% of these brands had at least two case studies recorded using different methods, or mentioned more than one method in the same case study. > **[HelloFresh](https://engineering.hellofresh.com/bayesian-media-mix-modeling-using-pymc3-for-fun-and-profit-2bd4667504e6): “The MMM is especially helpful in quantifying the impact of offline channels like television, billboards, or radio advertising, which are difficult to assess using digital measurement solutions.”** HelloFresh is one of the best-known companies among modern MMM proponents because it uses Bayesian techniques. Bayesian methods are helpful in the application of MMM because they allow for more complex specifications of the model while still capturing the underlying uncertainty. Many marketers tend to turn to MMM when they have a more complex marketing mix, like an advertiser that has multiple offline channels, for example. In fact, many of the clients we’ve worked with came to use it right around the time they decided to branch out into offline channels like TV or billboards, because of course you can’t measure these methods with digital tracking—you can’t click on a TV ad or billboard. > **[Resident (Nectar mattresses)](https://www.facebook.com/business/success/resident): “The optimization efforts have achieved a 20% increase in revenue with the same blended cost per acquisition. Five days to implement the Robyn model (compared to five working months to implement its in-house model).”** The case study from Resident, owner of the Nectar mattress brand, highlights both the benefit of MMM and the positive contribution of all of this investment in modern techniques. Done well, MMM should help you bring down your cost of acquisition or improve your return on investment, through helping you reallocate your budget. It’s easy for analysts to lose sight of that and fail to communicate the ultimate goal to the rest of the business, who get lost in the statistics. Meta’s open source library, Robyn, has democratized MMM for companies that didn’t have a data science team to custom build their models, and it does a fairly good job out of the box. It’s usually the first port of call for smaller clients, and often the people we work with have at least tested it on the path toward more sophisticated techniques. If you’re paying for a vendor to build your MMM, or working on your own custom solution, we recommend testing it head-to-head against Robyn to establish a good baseline for accuracy and performance. #### How to build a marketing mix model When it comes to building your first MMM, you should buckle up for a three- to six-month project if you have a complicated set of marketing activities to model. Data collection and formatting might take you 40% to 60% of this time, particularly if you don’t have your house in order already. Tech startups that already have all their data in a data warehouse will accelerate through this phase, whereas legacy businesses that operate in silos might take a significant amount of time. Beginning this project might also spawn other projects to clean up your data or collect more of it, depending on what you find when you go looking for the data you need. We’ve found you can bring that timeline down to a couple of weeks when working with a vendor who has automated all the data collection, reporting, and forecasting. On the lower end this can be as simple as using Supermetrics or Funnel.io to dump your data into a Google spreadsheet, but on the higher end it could mean working with a vendor that has built a data warehouse and all the necessary connectors to the main marketing channels and analytics platforms, like we have done at Recast. If you plan to build a model in-house, either [Meta’s Robyn](https://getrecast.com/facebook-robyn/) or [Google’s LightweightMMM](https://getrecast.com/google-lightweightmmm/) would be a good solid base, but they obviously have their limitations and will need some customization for your use case. [Uber’s Orbit](https://www.uber.com/en-MX/blog/orbit/) uses time-varying coefficients, which means the performance of marketing can change over time in their models, which we think is essential and, as such, built our models around this principle. Remarkably, most MMMs assume marketing never improves or changes in performance, even around important seasonal trends or economic events. If you plan to go for a completely custom build, plan in anything from an additional three months to two years, which is how long it took us to exit our R&D phase at Recast. MMM is a hard statistical problem to solve, and is unusually unsuitable for solving through modern machine learning techniques. MMM has the joint goal of being accurate but also explainable: a model is useless if it can’t tell you which channel contributed to sales historically, or help you forecast out what to spend in each channel. ### 3. CLS: Conversion lift studies Most people don’t know that marketers were using [randomized controlled trials](https://marketingmemetics.com/essays/scientific-marketing) before the first double-blind study was published in medicine! Claude Hopkins, who wrote the book *Scientific Advertising* in 1923, would regularly split his mailing list into multiple groups that would each get a different message so he could see what message worked best. Conversion lift studies (CLS) are still the gold standard of how advertising is measured, and serve as definitive proof of incrementality (how many of your sales wouldn’t have happened without ads). Nowadays the power of split testing, or A/B testing, is commonly known among marketers and product managers for landing page and [creative testing](https://marketingmemetics.com/performance-branding), but it can also be used for marketing measurement. It works by dividing the audience into randomly assigned groups and then turning off advertising to one of those groups to calculate the difference. There are more advanced statistical calculations that can be run to determine group selection and estimate what would have happened had you not turned off ads. “Geo lift” isn’t [immune from problems](https://getrecast.com/geo-testing/), and it can be complicated and expensive to set up and run these experiments, but it’s a solid technique.  There are two forms of testing that are most useful in determining the overall effectiveness of marketing. Many ad platforms, like Meta and Google, allow you to run CLS on the platform, where they define the parameters of the test and are responsible for dividing the audience. Even without a platform, you can run a geo-level experiment where you might turn off ads in five U.S. states and calculate the difference, using statistics to establish causal effects. #### How consumer brands use conversion lift studies There were relatively fewer case studies in this domain, perhaps because there aren’t as many vendors that offer it. Usually, in our experience, lift studies are done in-house using an open source library like [Meta’s GeoLift model](https://app.vexpower.com/sim/can-we-prove-the-roi-of-ads/) or with some custom code written by the data-science team. There are also platform lift tests, which are much more commonly run by large advertisers, but, again, this is a standard feature (only in some cases do you need to go through your platform representative), so not many people write publicly about it.  In the [database](https://airtable.com/shrzPkZvLTZtcsnbI) we found 16 instances of top brands talking about experiments/CLS in case studies, which is 38% of the brands featured. Here are a few select quotes we found interesting, to highlight how top consumer brands are thinking about this method: > **[Netflix](https://netflixtechblog.com/quasi-experimentation-at-netflix-566b57d2e362): “Usually we’d like to run a classic individual-level randomized experiment, but randomizing which individuals see a billboard ad, as an example, is not possible. However, while we cannot randomly assign individuals, we can randomly choose some cities within which to show billboards and other cities to leave without.”** Netflix makes the case for geo-testing, where you divide up your audience into geographical regions like cities, counties, or states, and turn off ads in some of those regions, to determine how many incremental sales the ads drove. This is often the only feasible way to run an experiment for many channels, because randomly assigning some part of the audience to not see ads is impossible or impractical. The benefit of this approach is that it works independently of what the platform offers, which means you don’t have to trust their in-platform lift testing methodology and can confirm the value of their channel for yourself. > **[Uber](https://papers.adkdd.org/2020/papers/adkdd20-barajas-advertising.pdf): “We measure a 6.57% decrease of conversions (statistically significant) when UAC spend is suspended. To our knowledge, our work is one of the earliest studies that successfully measures the incremental value of UAC with controlled experiments.”** This case study from Uber is the bread and butter of experimentation: determining the incremental value of a channel. Knowing that 6.57% of their conversions were attributable to UAC (Google’s Universal App Campaigns) helps them clearly calculate the return on investment for that channel and decide if they want to invest more or cut spend and re-attribute elsewhere. Experiments like this are important to Uber because they were the victim of a [$100 million fraud](https://veracitytrustnetwork.com/blog/digital-marketing/uber-ad-fraud/) in ad spend, ultimately suing their programmatic display vendor. The reports all looked great, but when they ran the incrementality numbers, they noticed that the conversions would have happened anyway, which tipped them off to the fact they were spending millions of dollars advertising to bots instead of real people. > **[McDonald’s](https://www.warc.com/newsandopinion/opinion/mmm-and-experiments-the-new-paradigm-to-measure-marketing-effectiveness/en-gb/5694): “In 2019, we used the Meta Marketing API to build a geo-test solution switching on and off Meta advertising for McDonald’s. We used the aggregated output to validate our MMM model, grounding the contribution to Meta’s advertising into the causal contribution identified in the experiment.”** This is becoming a common thread: using the results of one method to calibrate another. Using the results of a conversion lift study based on geographical regions helped McDonald’s build a more accurate marketing mix model, by establishing a ground truth with which to measure the model against. This can be really useful to keep the modeling process honest, because there are usually hundreds of potential models that fit the data. It’s important to bear in mind that incrementality tests are just a snapshot of a point in time. You learn the incrementality of the channel at that point when you run the test, but it doesn’t necessarily generalize over time. I’ve seen some scenarios where a channel that was found to be 90% incremental previously ended up being less than 20% incremental only four months later, because the ads team unknowingly dropped the setting that excludes existing customers. #### How to run a conversion lift study Most often, the first experience with lift studies is in-platform, for example using Meta’s native solution or the equivalent offered by Google. However, this only tells you about one channel, and not every channel offers this option. Many smaller digital channels outside of Google and Meta don’t offer in-platform incrementality tests, or they do offer it, but only if you’re a big spender and you insist on it. In many channels it's just not possible technically—for example, you can’t de-rank your website from Google search results for some users but not others—to test whether ranking makes a difference to traffic. If you don’t trust the platform to grade their own homework, or want to test a channel that doesn’t offer in-platform testing, the most common method is a geo-region test. If you’re planning to run these experiments in-house, Meta’s team open-sourced [GeoLift](https://app.vexpower.com/sim/can-we-prove-the-roi-of-ads/), a library that does the calculations and estimates a “synthetic control” (a weighted combination of similar regions), so that you can be sure you’re running a statistically valid experiment. Various factors can be adjusted in your experiments, so, for example, you can turn off some channels but not others, or run them in various combinations, to establish how they interact with each other. One of our favorite techniques is to run scale tests, where you increase spend in graduated steps in some regions but not in others, in order to see where a channel hits saturation due to diminishing returns. This can tell you how much headroom you have to expand investment in the channel, and at what point it gets too expensive to invest more in. ## How to get these methods working together We like to say that marketing measurement is like the parable of the [blind men and the elephant](https://en.wikipedia.org/wiki/Blind_men_and_an_elephant): every different marketing measurement method gives you a different view of true performance, but if you put all the pieces together you can triangulate the best answer for your business. That isn’t to say that it’s not worth pursuing the path of marketing measurement if you can’t use all three methods. If you’re just getting started with digital tracking, that’s great! You just need to keep in mind the limitations of the methodology and get ready to add on more sophisticated and complicated techniques when you’re ready. ### Triangulation, i.e. calibrating MTA with MMM with CLS Triangulation is where you use all three methods together, to triangulate the true performance of your marketing mix. It works like this: 1. Use your platform reports or analytics (MTA) to provide directional data for small daily optimizations like turning off a poor-performing ad or adjusting campaign settings. 2. Use your model (MMM) to forecast different budget allocations between channels, determining how much you can spend in a channel before it becomes inefficient. 3. Run lift tests (CLS) every few months, and use the results to calibrate the accuracy of your MMM: if these two methods agree, you can be more confident making predictions.  Triangulation helps us build on the strengths of each method and mitigate their weaknesses by not relying on a single source of truth. - Conversion lift studies will get you the closest to true incrementality, but it can be difficult and expensive to run them too frequently. Run an incrementality test once or twice a year, with more regular testing as your budget gets into the millions. - Marketing mix modeling is easier to get right when you can compare it against conversion lift studies. There are usually hundreds of different models that fit the data equally well, and this allows you to rule out the least plausible model configurations. - Multi-touch attribution is used directionally for smaller optimizations, because your marketing mix model usually won’t be that granular to the campaign or tactic level. Allocate your budget using your model, and use it to adjust your platform level reports. **Here’s how this might look in practice:** - If your budget is $1 million a year, with 80% spent on Google Ads, you could run lift tests for that channel quarterly, with your smaller channels (TikTok) tested annually. - Your last lift test told you Google Ads had an incremental cost per signup of $20, so you keep working on your MMM until it says the same for that time period. - Your model estimates that TikTok is only counting 80% of the conversions it actually generates, so when it reports $27 CPA it’s really achieving a $22 CPA.  ## To close Marketing measurement has never been an easy job, and the past few years have made it even harder. Multi-touch attribution is still the default starting point for most brands, but if you’re looking for more accuracy, you should consider marketing mix modeling and conversion lift studies to protect against wasted ad spend. Each method is useful in helping marketers optimize their campaigns and make better decisions, and by combining the strengths of each method, marketers can triangulate the truth and get a more accurate reading of how their campaigns are performing. ### 📚 Further study Marketing measurement is a huge topic, and we’re only just scratching the surface. If you’re keen to learn more, we recommend diving into the various links in the [database](https://airtable.com/shrzPkZvLTZtcsnbI), which we’ll keep updating. If you spot an interesting case study on MTA, MMM, or CLS, [please add it to the database](https://airtable.com/shrFVy4pMcAxjltBe), so we can make this the definitive place to look for marketing measurement insights. We’ve written extensively about these methods, in particular MMM, which is seeing a resurgence of interest post-iOS 14. Here are a few select posts from the Recast website, as well as a few courses for learning MMM: 1. [The Attribution Stack: How to Make Budget Decisions in a Post-iOS 14 World](https://www.reforge.com/blog/marketing-attribution-stack-after-ios14)—a piece we wrote for Reforge on how these methods work, and their strengths and weaknesses 2. [Operationalizing Modern MMM for Your Brand](https://getrecast.com/operationalizing-mmm-for-modern-brands/)—an e-book we collaborated on that walks through the entire end-to-end process for implementing MMM 3. [What’s the impact of TV ads?](https://app.vexpower.com/sim/whats-the-impact-of-tv-ads/)—an introductory-level course where you see the outputs of a simple MMM and learn how decisions are made based on the results 4. [How can Facebook drive negative sales?](https://app.vexpower.com/sim/how-can-facebook-drive-negative-sales/)—an online course we both worked on that teaches how to code your own simple Bayesian MMM, to understand how it works 5. [Validation through testing](https://getrecast.com/validation-through-testing/)—a blog post on using lift tests and experimentation to validate MMM results *Thank you, Michael and Mike!* *Have a fulfilling and productive week 🙏* **If you’re finding this newsletter valuable, share it with a friend, and consider subscribing if you haven’t already. Check out [group discounts](https://www.lennysnewsletter.com/subscribe?group=true) and [gift options](https://www.lennysnewsletter.com/subscribe?gift=true).** Sincerely, Lenny 👋